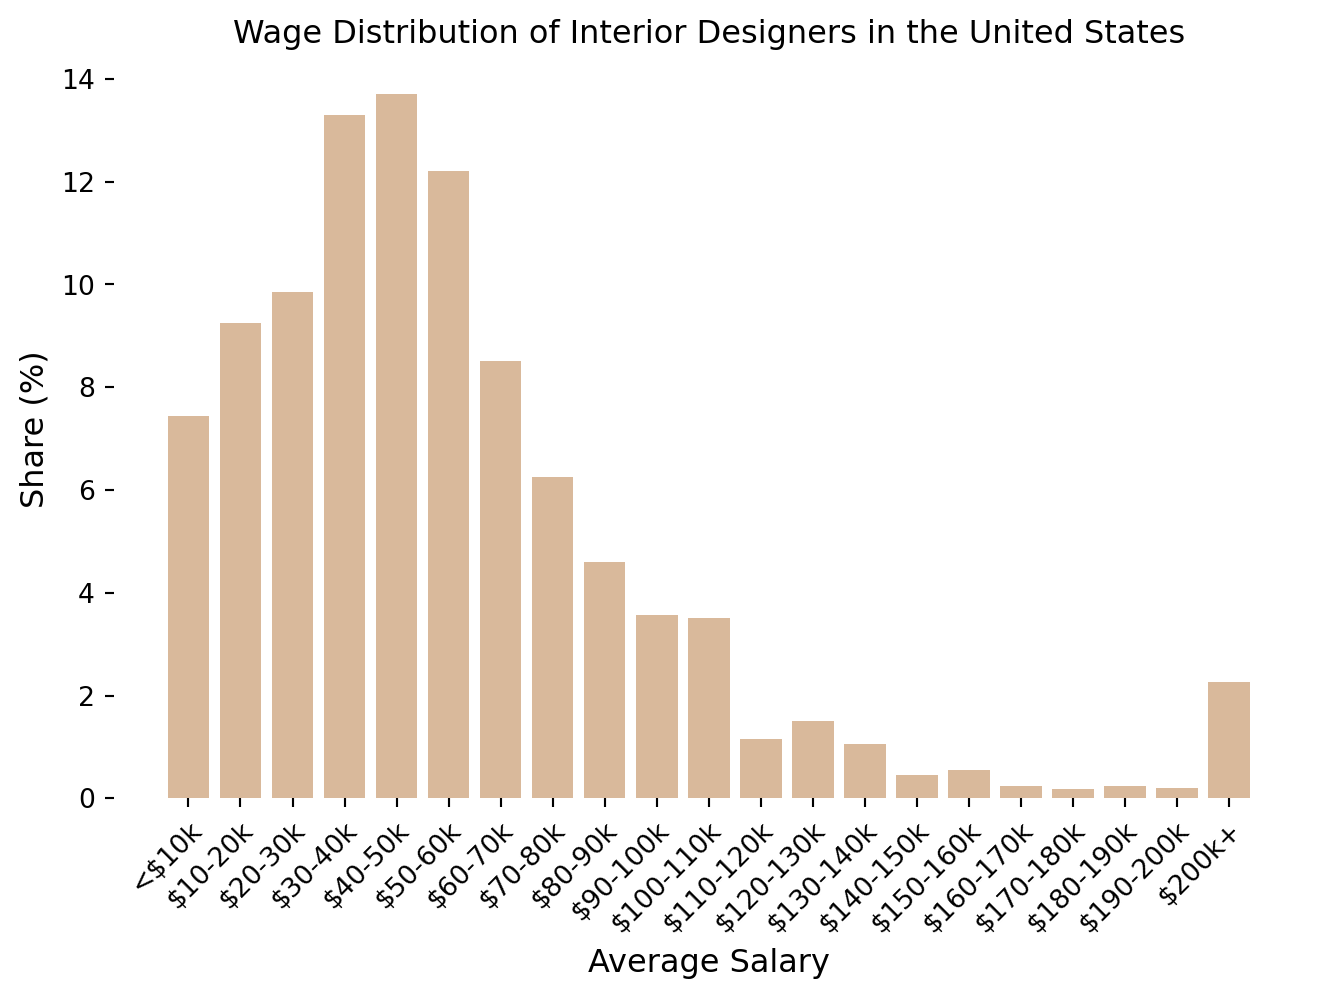
Salary Distribution of Interior Designers in the United States
CODE
#import libraries#pandas is useful for data manipulation and analysis tasksimport pandas as pd#matplotlib is used for data visualizationimport matplotlib.pyplot as plt#data source: https://datausa.io/profile/soc/interior-designers#use pandas to read the data from the comma-separated values (.csv) file#store the data in a dataframe and print itdf = pd.read_csv(r'data\salary_distribution_interior_design_USA.csv')#define the x and y elementssalary =list(df.iloc[:, 0])percentage =list(df.iloc[:, 1])# Plot the data using bar() methodplt.figure().set_figwidth(8)plt.bar(salary, percentage, color='#d9b99b')plt.title("Wage Distribution of Interior Designers in the United States")plt.xlabel("Average Salary", fontsize=12)plt.ylabel("Share (%)", fontsize=12)plt.xticks(fontsize=10, rotation=45,ha="right", rotation_mode="anchor")plt.box(False)# Show the plotplt.show()